[Paper] Translation of a paper on the novel coronavirus and genetics #2
![[Paper] Translation of a paper on the novel coronavirus and genetics #2](https://humedit.com/wp-content/uploads/paper.jpg)
Table of Contents
- Genetic Mechanisms of Severe Outcomes in Novel Coronavirus
- Methods
- Report Summary
- Data Availability
- Acknowledgments
- Additional Information
- Extended Data Figure 1 Q:Q Plot
- Extended Data Figure 2 MAIC Shared Information Content
- Extended Data Figure 3 Genomic Overlap between Cases and Controls
- Extended Data Figure 4 Effect Sizes in Ancestral Groups within the GenoMICC Study
- Extended Data Table 1 Baseline Characteristics of 2244 Patients
- Extended Data Table 2 Replication in External Data
Genetic Mechanisms of Severe Outcomes in Novel Coronavirus
Received: September 27, 2020
Accepted: November 30, 2020
Accelerated Article Preview Published
Online Published Date: December 11, 2020
This article cites: Pairo-Castineira, E. et al.
Genetic Mechanisms of Severe Outcomes
in Novel Coronavirus. Nature https://doi.org/10.1038/
s41586-020-03065-y (2020).
Methods
Case Recruitment
The 2,636 patients enrolled in the GenOMICC study (genomics.org) were confirmed to have Covid-19 through local clinical testing and were deemed by treating clinicians to require ongoing cardiopulmonary monitoring. In the UK, this type of monitoring is conducted in high-dependency units or intensive care units. Additionally, 135 patients were recruited through ISARIC4C (isaric4c.net); these patients were also confirmed to have Covid-19 through local clinical testing and were deemed to require hospitalization. Both studies were approved by the appropriate research ethics committees (Scotland: 15/SS/0110, England, Wales, and Northern Ireland: 19/WM/0247). The latest and previous versions of the trial protocols are available at genomic.org/protocol. All participants provided informed consent.
Genotyping
DNA was extracted from whole blood using the Nucleon Kit (Cytiva) following the BACC3 protocol. The DNA samples were resuspended in 1ml of TE buffer pH 7.5 (10mM Tris-Cl pH 7.5, 1mM EDTA pH 8.0). DNA yield was measured using Qubit and normalized to 50ng/μl before genotyping. Genotyping was performed using the Illumina Global Screening Array v3.0+ Multi-disease BeadChip (GSAMD-24v3-0-EA) and Infinium chemistry. In summary, this involves three stages: (1) whole-genome amplification, (2) fragmentation followed by hybridization, and (3) single-base extension and staining. For each sample, 4μl of DNA standardized to 50ng/μl was used. Each sample was queried on the array for 730,059 SNPs. The arrays were imaged on the Illumina iScan platform, and genotypes were automatically called using GenomeStudio Analysis Software v2.0.3, GSAMD-24v3-0-EA_20034606_A1.bpm manifest, and manufacturer-supplied cluster files. In 1667 cases, genotypes and supplementary variants were confirmed by whole-genome sequencing on the Illumina NovaSeq 6000. Samples were aligned to the human reference genome hg38, and variants were called to the GVCF stage using Genomics England's DRAGEN pipeline (software v01.011.269.3.2.22, hardware v01.011.269). Variants were filtered to a minimum depth of 8X using the GATK GenotypeGVCFs tool v4.1.8.1, with a 95% sensitivity for detecting heterozygous variants, and genotypes were integrated, annotated, and allele frequencies assigned using v1.10.2.
Quality Control
Genotype calls were carefully reviewed in GenomeStudio using the manufacturer's recommendations and 52 guidelines, excluding samples with initial call rates below 90%, and subsequently re-examining the data. Briefly, all X and Y marker calls, as well as autosomal markers with minor allele frequencies exceeding 1% that exhibited low Gentrain scores, poor cluster separation, or excess/deficiency of heterozygous calls, were visually inspected and curated as needed. Sex determination based on genotype was conducted in GenomeStudio, and samples not matching the expected records were excluded. Five individuals with XXY genotypes were detected and excluded from downstream GWAS analysis. Genotypes were exported using the GenomeStudio plink-input-report-plugin-v2-1-4 in the Genome Reference Consortium Human Build 37 (GRCh37) and Illumina "source" strand orientation. A series of filtering steps were then applied using PLINK 1.9, resulting in the further analysis of 2,790 individuals and 479,095 variants (excluding samples with call rates below 95%, variants with call rates above 99%, and variants with minor allele frequencies above 1%, and selecting final samples with call rates above 97%).
Consanguinity
Kinship and ancestry inference were calculated in accordance with the UK Biobank49 and the 1M Veteran Program.53. The analysis flagged 56 duplicate pairs, one of which was removed based on genotyping quality (GenomeStudio p50GC score and/or individual call rate). This resulted in a set of 2,734 unique individuals. High linkage disequilibrium (LD) regions as defined by the UK Biobank49 were excluded from the analysis, along with SNPs with MAF < 1% or missingness > 1%. Using King 2.1, the relationship matrix up to the third degree was constructed with the King command --kinship --degree 3. The function biggest_independent_vertex_set() from the igraph tool http://igraph.sf.net was used to create the initial set of unrelated individuals. Principal Component Analysis (PCA) was performed on the set of unrelated individuals with pruned SNPs using gcta 1.955, with a window size of 1000 markers, a step size of 80 markers, and an r2 threshold of 0.1. SNPs with high weights on PC1, PC2, or PC3 were removed, maintaining at least two-thirds of the pruned SNPs to retain as input for the next round of King 2.1. The second round of King 2.1 was performed with SNPs having low weights on PC1, PC2, and PC3 to avoid overestimating non-European relationships. After this round, 2,718 individuals were considered unrelated up to the third degree.
Genetic Ancestry
Unrelated individuals from the 1000 Genomes Project dataset were calculated using the same procedures described above, and both datasets were merged using common SNPs. The merged genotyped data were pruned with PLINK using a window size of 1000 markers, a step size of 50, and an r2 threshold of 0.05, resulting in 92K remaining markers. These markers were used to compute 20 principal components with gcta 1.9. The ancestry of GenOMICC individuals was inferred using the ADMIXTURE56 populations defined in the 1000 Genomes Project. If an individual had a probability greater than 80% of being related to a single ancestry, they were assigned to that ancestry; otherwise, they were classified as mixed ancestry, similar to the criteria used in the 1M Veteran cohort. According to this criterion, there were 1818 individuals of European ancestry (EUR), 190 of African ancestry (AFR), 158 of East Asian ancestry (EAS), 254 of South Asian ancestry (SAS), and 301 of mixed ancestry (2 or more).
Correction
Genotype files were converted to the plus strand, and SNPs with a Hardy-Weinberg Equilibrium (HWE) p-value < 10^-6 were removed. Imputation was performed using the TOPMed reference panel57, and the results were provided in the GRCh38 human reference genome and plus strand. The imputed dataset was filtered for monogenic and low imputation quality scores (r2 < 0.4) using BCFtools 1.9. To perform GWAS, files in VCF format were further filtered with r2 > 0.9. We extracted imputed variants overlapping with our variant set (n=5,981,137) with an imputation score > 0.9 from the UK Biobank using QCtools 1.3. The GenOMICC data were merged with the case and control data into a single BGEN file using QCtools 1.3.
GWAS
Third-degree related individuals were removed. Thirteen individuals of American ancestry were excluded due to insufficient detection power for a reliable GWAS in this population. The final dataset consisted of 2,244 individuals. Using PCA, genetic ancestry was estimated, resulting in 1,676 Europeans, 149 East Asians, 237 South Asians, and 182 Africans (Extended Data Table 1). If age or deprivation status was missing for some individuals, these values were set to the mean for that ancestry. GWAS was performed separately for each ancestry group. Tests of association between case-control status and allele dosage at individual SNPs for each ancestry group were conducted using logistic regression models in PLINK.59. All models included sex, age, age squared, the deprivation score decile of the residential postal code, and the first 10 genomic principal components as covariates.
Genomic principal components were calculated on the combined sample of UK Biobank and all GenOMICC participants. Specifically, 456,750 genetic variants were identified, shared between the variants included in the GenOMICC dataset and the imputed UK Biobank genotypes with an imputation info score greater than 0.95 and a minor allele frequency greater than 1%. After integrating genotypes at these variants, those with minor allele frequency less than 2.5%, missingness greater than 1.5%, deviation from Hardy-Weinberg equilibrium at p < 10^-50, or located within previously identified UK Biobank LD regions were removed. Using the PLINK indep-pairwise command, the remaining variants were LD-pruned based on a 1000-variant window moving in 50-variant steps with a maximum r2 of 0.01, resulting in 13,782 SNPs. Principal components were then calculated using FlashPCA2.60.
The GWAS results for Europeans were filtered for MAF > 0.01, HWE p-value > 10^-50, and genotype call rate > 0.99. Additional filters were applied to avoid biases due to different genotyping methods and control panels for cases and controls, which could not be controlled using regression analysis because all cases and controls were genotyped differently. Comparing the MAF of UK Biobank European controls and non-Finnish European gnomAD hg38 downloaded in August 2020, (a) SNPs with MAF > 10% showed a 5% absolute difference between gnomAD and UK Biobank control MAF, and (b) SNPs with MAF < 10% in gnomAD showed a 25% gnomAD MAF difference with UK Biobank controls. Non-European GWAS results were filtered for MAF with UK Biobank controls matched to > 5% for the same ancestry and QC-passed SNPs in the European GWAS. Non-Finnish European gnomAD allele frequencies were used to calculate the allele frequency difference with UK Biobank European controls since UK Biobank controls are primarily non-Finnish. Filtered GWAS for each ancestry, containing approximately 4.7M SNPs, were combined in a trans-ethnic meta-analysis using METAL62 standard error mode and controlled for population stratification (genomic control on). The nearest gene was defined using FUMA v1.3.6 SNP2GENE function63 with LD R2 > 0.6 and the UK Biobank release 2 reference panel. Sex-specific GWAS in Europeans were performed using 1,180 unrelated male cases and 496 unrelated female cases matched for sex and family to each case, and five random UK Biobank controls per case. Tests of association between case-control status and allele dosage at individual SNPs were conducted using logistic regression models in PLINK. Models included age, age squared, the deprivation score decile of the residential postal code, and the first 10 principal components as covariates.
Deprivation Score
The UK Data Service provides deprivation measures generated for each postal code based on census data. The latest deprivation scores were released in 2017, based on the 2011 census. Since only partial postal codes were available for most samples, these measures could not be used directly. However, by calculating a weighted average of the scores based on the population numbers across top-level postal code areas, an approximate score was generated. The initial input file is part of the aggregate census data identified at https://doi.org/10.5257/census/aggregate-2011-2. Specifically, postal code data was downloaded from http://s3-eu-west-1.amazonaws.com/statistics.digitalresources.jisc.ac.uk/dkan/files/Postcode_Counts_and_Deprivation_Ranks/postcodes.zip. For each top-level postal code, the population numbers and deprivation scores for each published postal code were extracted, and a weighted average score was calculated. Additionally, for coarser analysis, each top-level postal code score was categorized into deciles and quintiles.
Whole Genome Sequencing
Whole-genome sequencing (WGS) gVCF files were obtained for 1,667 individuals with whole-genome sequence data. Variants overlapping the positions of the imputed variants were called using GATK, and variants with depth < 8X (the minimum depth expected to provide 95% coverage) were filtered out. Individual VCF files were combined into multi-sample VCF files and compared with imputed variants. Of the 1,667 samples, 1,613 were used in the final GWAS. Samples were filtered and variants annotated using bcftools 1.9. VCF files obtained from imputation were processed in the same way. For both WGS and imputed data, allele frequencies were calculated using PLINK 2.064.
Controls
UK Biobank
Participants from the UK Biobank who were not identified as outliers based on genotyping missingness or heterogeneity by the UK Biobank, and whose genetically inferred sex matched their self-reported sex, were considered potential controls. For these individuals, information on sex (UKBID 31), age, ancestry, and the deprivation score decile of their residential postal code was calculated. Specifically, age was calculated as of April 1, 2020, based on the participant's month (UKBID 34) and year (UKBID 52) of birth. The first part of the residential postal code, based on the participant's address (UKBID 22702 and 22704), was used to map the deprivation score decile, as described previously for GenOMICC participants. Ancestry was inferred as previously reported for GenOMICC participants. Based on information downloaded from the UK Biobank in August 2020, after excluding participants who had undergone PCR testing for Covid-19, five controls with matching inferred ancestry were sampled for each GenOMICC participant. After sampling each control group, individuals related up to the third degree were excluded from potential additional control groups. Additional analyses were conducted to achieve more stringent matching on individual characteristics (Supplementary Information: Matched Controls).
100,000 Genomes Project
With ethical approval (14/EE/1112 and 13/EE/032), participants who consented to the 100,000 Genomes Project were enrolled at NHS Genomic Medicine Centers in 13 regions of England, Northern Ireland, Scotland, and Wales, and whole blood was collected for DNA extraction. Following quality assurance, whole genome sequencing (125 or 150 base pairs) was performed using the Hiseq 2500 or Hiseq X sequencers at the Genomics England Sequencing Centre by Illumina Laboratory Services, and small variants (single nucleotide variants and small indels) were detected using Starling. Association testing between case-control status was conducted using mixed model association tests with SAIGE (v0.39). The study included 1,675 individuals from the GenOMICC study and 45,875 unrelated participants of European ancestry. Genomic principal components were calculated for the combined dataset of whole genome sequence data from GenOMICC study participants and the 100,000 Genomes Project. Principal component analysis (PCA) was performed using GCTA software on approximately 30,000 SNPs selected after LD pruning (r2 < 0.1, window size 500kb) and with minor allele frequency > 0.005. Null logistic mixed model fitting was performed using the SNPs from PCA, including age, sex, age squared, age × sex, and the first 20 genomic principal components as covariates. Association testing with SAIGE was performed after filtering variants in the WGS dataset for genotype quality and minor allele frequency ≥ 0.05. GWAS-specific quality filtering included variants with a minor allele count of 20 or more per phenotype, differential missingness between cases and controls (p-value < 1 × 10^-5), and deviation from Hardy-Weinberg equilibrium (p-value < 1 × 10^-5).
Generation Scotland
Generation Scotland: The Scottish Family Health Study
Generation Scotland (GS) is a population-based cohort consisting of 24,084 participants collected from five regional centers across Scotland. The majority of participants were genotyped using either the Illumina HumanOmniExpressExome-8v1_A or v1-2, with 20,032 passing the previously described QC criteria. Genotype imputation using the TOPMed reference panel was recently performed using Minimac4 v1.0 on the Michigan Imputation Server (https://imputationserver.sph.umich.edu) (freeze 5b). For quality checks of the imputed variants, imputation data from 7,689 unrelated participants (estimated genomic sharing identity by descent < 5% using PLINK 1.9) were used as control genotypes for the GWAS of GenOMICC cases of European ancestry. The GWAS was conducted in a logistic regression framework implemented in PLINK2 (https://www.cog-genomics.org/plink/2.0/) glm function, adjusting for age, sex, and the first 10 principal components of European ancestry. These coordinates were obtained from projection onto the principal component space of the 1000 Genomes European population samples using KING v2.2.2.554, from a subset of LD-pruned target genotype markers that passed quality checks and intersected with the reference population.
Validation
The consistency of hit counts in the discovery GWAS was verified as follows. Controls from Generation Scotland and 100K were used. For a hit to be considered validated, the effect direction had to be the same in all three GWAS, and the p-value in both Generation Scotland and 100K had to be p < 0.05/nvalidations (where nvalidations is the number of significant independent loci in the analysis at the discovery threshold p < 5 × 10^-8).
Replication
GenOMICC EUR loci were defined using the PLINK 1.964 clumping function with clumping parameters r2 = 0.1, pval = 5 × 10^-8, and pval2 = 0.01, and the distance to the nearest gene was calculated using ENSEMBL GRCh37 gene annotations. There are no GWAS reports on severe disease or death in Covid-19. As a substitute, we conducted replication analyses using the Host Genetics Initiative build 37, version 2 (July 2020) B2 (hospitalized Covid-19 vs. population) GWAS to provide partial replication of our findings. To avoid sample overlap, we included all cohorts and GWAS except for those including the UK Biobank and used summary statistics from the full analysis. The replication p-value was set at 6.25 × 10^-4 (0.05/8, where 8 is the number of significant loci in the discovery).
Genome-Wide Meta-Analysis
The meta-analysis between GenOMICC, HGI, and 23andMe was conducted using a fixed-effects inverse-variance meta-analysis in METAL,62, with correction for genomic control. The 23andMe study consisted of cases and controls from the EUR genetic ancestry group. The HGI B2 analysis was a trans-ancestry meta-analysis, with the majority of cases being multi-ethnic European (EUR and FIN) and 238 non-European ancestry cases (Admixed American (AdMIX), AMR, BRACOVID study, SAS South Asian 62 cases, GNH study).
Post-GWAS Analysis
TWAS and Meta-TWAS
Transcriptome-wide association was performed using the MetaXcan framework23 and the downloadable GTEx v8 eQTL MASHR-M models (http://predictdb.org/). To increase SNP coverage for TWAS, the initial GWAS summary statistics for European ancestry were imputed using the FUSION69 imputation function (https://github.com/bogdanlab/fusion) with the 1000 Genomes European population as the LD reference and a minimum proportion of 30% of SNPs in a region (-min-prop 0.3). The imputed GWAS results were then harmonized, lifted over to hg38, and linked to the 1000 Genomes reference panel using the GWAS tools (https://github.com/hakyimlab/summary-gwas-imputation/wiki/GWAS-Harmonization-And-Imputation). The imputed and harmonized GWAS summary statistics were used to perform TWAS for whole blood (Supplementary Figure 16) and lung (Figure 2) GTEx v8 tissues using the S-PrediXcan function. The resulting p-values were corrected using Bonferroni correction to identify significant gene associations. To overcome the limitations of sample sizes in GTEx v8 lung and whole blood tissues, genes with small p-values in these tissues were prioritized using S-MultiXcan70 with GTEx v8 gene expression across all tissues.
Mendelian Randomization
The two-sample summary database based on Mendelian randomization19 was conducted using GenOMICC and the results from the Genotype-Tissue Expression project71 GTEx v7 (using pre-prepared SMR/HEIDI data: https://cnsgenomics.com/software/smr/#DataResource), with Generation Scotland65,72 forming the linkage disequilibrium reference. The results from GenOMICC of European ancestry were used as outcomes. Whole blood expression from GTEx (v7) was used as exposure. Additional data related to GTEx v7 was downloaded from GTEx: https://gtexportal.org/ (accessed February 20, 2020, April 5, 2020, and July 4, 2020), and SMR/HEIDI was downloaded from https://cnsgenomics.com/software/smr/ (accessed July 3, 2020). Analyses were conducted using Python 3.7.3 and SMR/HEIDI v1.03 (plots were created using SMR/HEIDI v0.711). The LD reference was created using data from the population-based Generation Scotland cohort (used with permission, as previously described67). A random set of 5,000 individuals was created using Plink v1.9 (www.cog-genomics.org/plink/1.9/), and individuals with a genomic relatedness cutoff of < 0.01 were extracted. 2,778 individuals remained in the final set. All data used for SMR/HEIDI analysis was restricted to autosomal bi-allelic SNPs, with 4,264,462 variants remaining in the final merged dataset. Significant (according to GTEx v7; nominal p-value below the nominal p-value threshold) local (distance to transcription start site < 1Mb) protein-coding genes (according to GENCODE v19) from GTEx v7 whole blood eQTL, MAF > 0.01 (GTEx v7 and GenOMICC) were considered as potential instrumental variables. For each variant, the Ensembl gene ID most strongly associated was selected first, followed by the most strongly associated variant for each Ensembl gene ID. Instruments were available for 4,614 unique Ensembl gene IDs. Results were evaluated based on a preselected list of genes of interest (Supplementary Table 3) and as a whole. Replication of Bonferroni-corrected significant results was attempted with results from the Covid-19-Host Genetics Initiative (https://www.covid19hg.org/) using the eQTLgen summary dataset excluding UK Biobank (July 2, 2020 data release). The cohort of Covid-19 hospitalized patients versus the population (ANA_B2_V2) was selected as the replication cohort due to its similarity to our phenotype. To further validate the above analyses, generalized summary data Mendelian randomization (GSMR)73 was performed using publicly available exposure data (https://www.eqtlgen.org/index.html, accessed October 26, 2020) and GenOMICC EUR data available at TYK2 and IFNAR2 (Supplementary Figure 15). GSMR was conducted using GCTA version 1.92.1 beta6 Linux. Pleiotropic SNPs were filtered using the HEIDI outlier test (threshold = 0.01), and instrument SNPs were selected at genome-wide significance (PeQTL < 5e-8) using LD clumping (LD r2 threshold = 0.05 and window size = 1Mb). The imputed genotypes from 50,000 unrelated individuals in the UK Biobank (SNP-derived genomic relatedness < 0.05, using HapMap 3 SNPs) were used as the LD reference for clumping. GSMR accounts for remaining LD not removed by LD clumping.
Genomic Region Plot
Genomic region plots were created using https://github.com/Geeketics/LocusZooms (Supplementary Figures 5 and 6).
Gene-Level and Pathway Analysis
Gene-level significance burden in the results of EUR ancestry was calculated using MAGMA v1.08 (Supplementary Figure 17).74 SNPs were assigned to genes if their position was within 5 kb upstream or downstream of the gene region (defined from transcription start site to transcription stop site). MAGMA SNP-wise mean method was applied, using the sum of squared SNP Z-statistics as the test statistic. LD between SNPs was estimated using the 1000 Genomes Project European reference panel. Auxiliary files were downloaded from MAGMA on September 1, 2020, at https://ctg.cncr.nl/software/magma. Gene location files for protein-coding genes were obtained from NCBI (ftp.ncbi.nlm.nih.gov): gene/DATA/GENE_INFO/Mammalia/Homo_sapiens.gene_info.gz on 29/04/2015, and genomes/Homo_sapiens/ARCHIVE/ANNOTATION_RELEASE.105/mapview/seq_gene.md.gz on 25/05/2016. The reference data files used to estimate LD were derived from the 1000 Genomes Project phase 3. Competitive gene set analysis was performed in MAGMA using a regression model accounting for gene-gene correlation to reduce bias from the clustering of functionally similar genes on the genome.74 Gene sets were queried from the databases KEGG 2019, Reactome 2016, GO Biological Process 2018, Biocarta 2016, and WikiPathways 2019. False discovery rate (<0.05) was controlled using the Benjamini-Hochberg method.
Meta-Analysis by Information Content
To relate these results to existing biological data on host genes involved in SARS-CoV-2 replication and response, a gene-level analysis (MAIC)24 of GenOMICC metaTWAS was performed in conjunction with a systematic review of existing host factors involved in SARS-CoV-2 viral replication and Covid-19 host response.45 To evaluate and integrate gene-level data from diverse sources, a meta-analysis by information content (MAIC) was developed.24 Multiple in vitro and in vivo studies have identified key host genes that either interact directly with SARS-CoV-2 or define the host response to SARS-CoV-2. A systematic review of these studies was previously conducted.45 To contextualize new associations from this GWAS, the authors conducted a data-driven meta-analysis of gene-level results combined with existing biological data using MAIC.24 Briefly, MAIC aggregates both ranked and unranked lists and has shown better performance than other methods, especially when presented with heterogeneous source data. Input to MAIC is a list of named genes. MAIC assigns a score to each gene based on the number of source datasets reporting that gene and creates data-driven weighting for each data source (typically individual experiments) based on the scores of the top-ranked genes in that list. This procedure is repeated until the scores and weights converge to stable values. To prevent a single type of experiment from unduly biasing the results, a rule was applied to assign input gene lists to categories, allowing only one weighting from each category to contribute to any gene's score.
Tissue/Functional Genomic Enrichment
We downloaded the average gene expression data summarized from RNA sequencing by the GTEx project (https://gtexportal.org/). The GTEx v7 data includes gene expression for 19,791 genes across 48 human tissues. Gene expression values were normalized as transcripts per million (TPM). To measure gene expression specificity in each tissue, we defined gene expression specificity as the proportion of its expression in each tissue relative to its expression across all tissues, resulting in values ranging from 0 to 1. For functional genomic enrichment analysis, we considered the primary functional annotations v2.2 provided by the built-in ldsc software (https://alkesgroup.broadinstitute.org/LDSCORE/) to annotate SNPs. Using the annotated SNPs, we tested whether human tissues or specific functional genomic features were associated with severe Covid-19 using stratified LD score regression (S-LDSC).75 Our GWAS summary statistics were harmonized using the munge_sumstats.py procedure of ldsc. The LD scores for gene annotations in each tissue were calculated for HapMap3 SNPs (excluding the MHC region) using a 1-cM window. Enrichment scores were defined as the proportion of heritability captured by the annotated SNPs divided by the proportion of annotated SNPs.
Genetic Correlations
We applied both LD score regression (LDSC)76 and high-definition likelihood (HDL)25 methods to evaluate the genetic correlation between Severe Covid-19 and 818 GWAS target phenotypes stored in LD-Hub.77 In the HDL analysis, SNP-based narrow-sense heritability was estimated for each phenotype, and for the GWAS of 818 composite traits, those with less than 90% overlap with the HDL reference panel were excluded.
Genomic Architecture
The results are displayed using Genome Reference Consortium Human Build37. The assigned genotypes and whole-genome sequence data were lifted over from Genome Reference Consortium Human Build38 using the GATK4.0 Picard liftover VCF mode, based on the UCSC liftOver tool (ftp://ftp.ensembl.org/pub/assembly_mapping/homo_sapiens/GRCh38_to_GRCh37.chain.gz).78
Report Summary
For detailed information on the study design, refer to the summary of the Nature Research Reporting Summary linked to this paper.
Data Availability
Complete summary-level data supporting the results of this study are available at https://genomicc.org/data. Individual-level data can be analyzed by qualified researchers on the ISARIC4C/GenOMICC data analysis platform by applying at https://genomicc.org/data. The complete GWAS summary statistics for the 23andMe discovery dataset are available to qualified researchers through 23andMe, under an agreement to protect the privacy of 23andMe participants. For details and to apply for access to the data, visit https://research.23andMe.com/dataset-access/.
- McKenna, A., Hanna, M., Banks, E., Sivachenko, A., Cibulskis, K., Kernytsky, A., Garimella, K., Altshuler, D., Gabriel, S., Daly, M. & DePristo, M.A. The Genome Analysis Toolkit: A MapReduce framework for analyzing next-generation DNA sequencing data. Genome Research 20, 1297–1303 (2010).
- Meynert, A.M., Ansari, M., FitzPatrick, D.R. & Taylor, M.S. Variant detection sensitivity and biases in whole genome and exome sequencing. BMC Bioinformatics 15, 247 (2014).
- Guo, Y., He, J., Zhao, S., Wu, H., Zhong, X., Sheng, Q., Samuels, D.C., Shyr, Y. & Long, J. Illumina human exome genotyping array clustering and quality control. Nature Protocols 9, 2643–2662 (2014).
- Gaziano, J.M., Concato, J., Brophy, M., Fiore, L., Pyarajan, S., Breeling, J., Whitbourne, S., Deen, J., Shannon, C., Humphries, D., Guarino, P., Aslan, M., Anderson, D., LaFleur, R., Hammond, T., Schaa, K., Moser, J., Huang, G., Muralidhar, S., Przygodzki, R. & OLeary, T.J. Million Veteran Program: A mega-biobank to study genetic influences on health and disease. Journal of Clinical Epidemiology 70, 214–223 (2016).
- Manichaikul, A., Mychaleckyj, J.C., Rich, S.S., Daly, K., Sale, M. & Chen, W.-M. Robust relationship inference in genome-wide association studies. Bioinformatics (Oxford, England) 26, 2867–2873 (2010).
- Yang, J., Lee, S.H., Goddard, M.E. & Visscher, P.M. GCTA: A tool for genome-wide complex trait analysis. American Journal of Human Genetics 88, 76–82 (2011).
- Alexander, D.H. & Lange, K. Enhancements to the ADMIXTURE algorithm for individual ancestry estimation. BMC Bioinformatics 12, 246 (2011).
- D, T., Dn, H., Md, K., J, C., Za, S., R, T., Sag, T., A, C., Sm, G., Hm, K., An, P., J, L., S, L., X, T., Bl, B., S, D., A, E., We, C., Dp, L., Ac, S., Tw, B., Q, W., Dk, A., Ae, A.-K., Kc, B., E, B., S, G., R, G., Km, R., Ss, R., E, S., P, Q., W, G., Gj, P., Da, N., Sr, B., Mc, Z., S, Z., Jg, W., La, C., Cc, L., Ce, J., Rd, H., Td, O. & Gr, A. Sequencing of 53,831 diverse genomes from the NHLBI TOPMed Program. (2019). https://doi.org/10.1101/563866.
- Wigginton, J.E., Cutler, D.J. & Abecasis, G.R. A note on exact tests of Hardy-Weinberg equilibrium. American Journal of Human Genetics 76, 887–893 (2005).
- Chang, C.C., Chow, C.C., Tellier, L.C., Vattikuti, S., Purcell, S.M. & Lee, J.J. Second-generation PLINK: Rising to the challenge of larger and richer datasets. GigaScience 4, 7 (2015).
- Abraham, G., Qiu, Y. & Inouye, M. FlashPCA2: Principal component analysis of biobank-scale genotype datasets. Bioinformatics (Oxford, England) 33, 2776–2778 (2017).
- Karczewski, K.J., Francioli, L.C., Tiao, G., Cummings, B.B., Alföldi, J., Wang, Q., Collins, R.L., Laricchia, K.M., Ganna, A., Birnbaum, D.P., Gauthier, L.D., Brand, H., Solomonson, M., Watts, N.A., Rhodes, D., Singer-Berk, M., England, E.M., Seaby, E.G., Kosmicki, J.A., Walters, R.K., Tashman, K., Farjoun, Y., Banks, E., Poterba, T., Wang, A., Seed, C., Whiffin, N., Chong, J.X., Samocha, K.E., Pierce-Hoffman, E., Zappala, Z., O'Donnell-Luria, A.H., Minikel, E.V., Weisburd, B., Lek, M., Ware, J.S., Vittal, C., Armean, I.M., Bergelson, L., Cibulskis, K., Connolly, K.M., Covarrubias, M., Donnelly, S., Ferriera, S., Gabriel, S., Gentry, J., Gupta, N., Jeandet, T., Kaplan, D., Llanwarne, C., Munshi, R., Novod, S., Petrillo, N., Roazen, D., Ruano-Rubio, V., Saltzman, A., Schleicher, M., Soto, J., Tibbetts, K., Tolonen, C., Wade, G., Talkowski, M.E., Neale, B.M., Daly, M.J. & MacArthur, D.G. The mutational constraint spectrum quantified from variation in 141,456 humans. Nature 581, 434–443 (2020).
- Willer, C.J., Li, Y. & Abecasis, G.R. METAL: Fast and efficient meta-analysis of genomewide association scans. Bioinformatics (Oxford, England) 26, 2190–2191 (2010).
- Watanabe, K., Taskesen, E., van Bochoven, A. & Posthuma, D. Functional mapping and annotation of genetic associations with FUMA. Nature Communications 8, 1826 (2017).
- Purcell, S., Neale, B., Todd-Brown, K., Thomas, L., Ferreira, M.A.R., Bender, D., Maller, J., Sklar, P., Bakker, P.I.W. de, Daly, M.J. & Sham, P.C. PLINK: A tool set for whole-genome association and population-based linkage analyses. American Journal of Human Genetics 81, 559–575 (2007).
- Smith, B.H., Campbell, A., Linksted, P., Fitzpatrick, B., Jackson, C., Kerr, S.M., Deary, I.J., Macintyre, D.J., Campbell, H., McGilchrist, M., Hocking, L.J., Wisely, L., Ford, I., Lindsay, R.S., Morton, R., Palmer, C.N.A., Dominiczak, A.F., Porteous, D.J. & Morris, A.D. Cohort profile: Generation Scotland: Scottish family health study (GS:SFHS). The study, its participants, and potential for genetic research on health and illness. International Journal of Epidemiology 42, 689–700 (2013).
- Amador, C., Huffman, J., Trochet, H., Campbell, A., Porteous, D., Wilson, J.F., Hastie, N., Vitart, V., Hayward, C., Navarro, P. & Haley, C.S. Recent genomic heritage in Scotland. BMC Genomics 16, 437 (2015).
- Nagy, R., Boutin, T.S., Marten, J., Huffman, J.E., Kerr, S.M., Campbell, A., Evenden, L., Gibson, J., Amador, C., Howard, D.M., Navarro, P., Morris, A., Deary, I.J., Hocking, L.J., Padmanabhan, S., Smith, B.H., Joshi, P., Wilson, J.F., Hastie, N.D., Wright, A.F., McIntosh, A.M., Porteous, D.J., Haley, C.S., Vitart, V. & Hayward, C. Exploration of haplotype research consortium imputation for genome-wide association studies in Generation Scotland participants. Genome Medicine 9, 23 (2017).
- Das, S., Forer, L., Schönherr, S., Sidore, C., Locke, A.E., Kwong, A., Vrieze, S.I., Chew, E.Y., Levy, S., McGue, M., Schlessinger, D., Stambolian, D., Loh, P.-R., Iacono, W.G., Swaroop, A., Scott, L.J., Cucca, F., Kronenberg, F., Boehnke, M., Abecasis, G.R. & Fuchsberger, C. Next-generation genotype imputation service and methods. Nature Genetics 48, 1284–1287 (2016).
- Pasaniuc, B., Zaitlen, N., Shi, H., Bhatia, G., Gusev, A., Pickrell, J., Hirschhorn, J., Strachan, D.P., Patterson, N. & Price, A.L. Fast and accurate imputation of summary statistics enhances evidence of functional enrichment. Bioinformatics (Oxford, England) 30, 2906–2914 (2014).
- Barbeira, A.N., Pividori, M., Zheng, J., Wheeler, H.E., Nicolae, D.L. & Im, H.K. Integrating predicted transcriptome from multiple tissues improves association detection. PLoS Genetics 15, e1007889 (2019).
- Battle, A., Brown, C.D., Engelhardt, B.E. & Montgomery, S.B. Genetic effects on gene expression across human tissues. Nature 550, 204–213 (2017).
- Smith, B.H., Campbell, H., Blackwood, D., Connell, J., Connor, M., Deary, I.J., Dominiczak, A.F., Fitzpatrick, B., Ford, I., Jackson, C., Haddow, G., Kerr, S., Lindsay, R., McGilchrist, M., Morton, R., Murray, G., Palmer, C.N.A., Pell, J.P., Ralston, S.H., St Clair, D., Sullivan, F., Watt, G., Wolf, R., Wright, A., Porteous, D. & Morris, A.D. Generation Scotland: The Scottish Family Health Study; a new resource for researching genes and heritability. BMC Medical Genetics 7, 74 (2006).
- Zhu, Z., Zheng, Z., Zhang, F., Wu, Y., Trzaskowski, M., Maier, R., Robinson, M.R., McGrath, J.J., Visscher, P.M., Wray, N.R. & Yang, J. Causal associations between risk factors and common diseases inferred from GWAS summary data. Nature Communications 9, 224 (2018).
- de Leeuw, C.A., Mooij, J.M., Heskes, T. & Posthuma, D. MAGMA: Generalized gene-set analysis of GWAS data. PLoS Computational Biology 11, e1004219 (2015).
- Finucane, H.K., Bulik-Sullivan, B., Gusev, A., Trynka, G., Reshef, Y., Loh, P.-R., Anttila, V., Xu, H., Zang, C., Farh, K., Ripke, S., Day, F.R., Purcell, S., Stahl, E., Lindstrom, S., Perry, J.R.B., Okada, Y., Raychaudhuri, S., Daly, M.J., Patterson, N., Neale, B.M. & Price, A.L. Partitioning heritability by functional annotation using genome-wide association summary statistics. Nature Genetics 47, 1228–1235 (2015).
- Bulik-Sullivan, B., Finucane, H.K., Anttila, V., Gusev, A., Day, F.R., Loh, P.-R., Duncan, L., Perry, J.R.B., Patterson, N., Robinson, E.B., Daly, M.J., Price, A.L. & Neale, B.M. An atlas of genetic correlations across human diseases and traits. Nature Genetics 47, 1236–1241 (2015).
- Zheng, J., Erzurumluoglu, A.M., Elsworth, B.L., Kemp, J.P., Howe, L., Haycock, P.C., Hemani, G., Tansey, K., Laurin, C., Pourcain, B.S., Warrington, N.M., Finucane, H.K., Price, A.L., Bulik-Sullivan, B.K., Anttila, V., Paternoster, L., Gaunt, T.R., Evans, D.M. & Neale, B.M. LD Hub: A centralized database and web interface to perform LD score regression that maximizes the potential of summary level GWAS data for SNP heritability and genetic correlation analysis. Bioinformatics (Oxford, England) 33, 272–279 (2017).
- Hinrichs, A.S., Karolchik, D., Baertsch, R., Barber, G.P., Bejerano, G., Clawson, H., Diekhans, M., Furey, T.S., Harte, R.A., Hsu, F., Hillman-Jackson, J., Kuhn, R.M., Pedersen, J.S., Pohl, A., Raney, B.J., Rosenbloom, K.R., Siepel, A., Smith, K.E., Sugnet, C.W., Sultan-Qurraie, A., Thomas, D.J., Trumbower, H., Weber, R.J., Weirauch, M., Zweig, A.S., Haussler, D. & Kent, W.J. The UCSC Genome Browser Database: Update 2006. Nucleic Acids Research 34, D590–D598 (2006).
- Sun, J., Ye, F., Wu, A., Yang, R., Pan, M., Sheng, J., Zhu, W., Mao, L., Wang, M., Huang, B., Tan, W. & Jiang, T. Comparative transcriptome analysis reveals intensive early stage responses of host cells to SARS-CoV-2 infection. (2020). https://doi.org/10.1101/2020.04.30.071274.
- Rosa, B.A., Ahmed, M., Singh, D.K., Choreno-Parra, J.A., Cole, J., Jimenez-Alvarez, L.A., Rodriguez-Reyna, T.S., Singh, B., Golzalez, O., Carrion, R., Schlesinger, L.S., Martin, J., Zuniga, J., Mitreva, M., Khader, S.A. & Kaushal, D. IFN signaling and neutrophil degranulation transcriptional signatures are induced during SARS-CoV-2 infection. bioRxiv : the preprint server for biology (2020). https://doi.org/10.1101/2020.08.06.239798.
- Zhang, J.-Y., Wang, X.-M., Xing, X., Xu, Z., Zhang, C., Song, J.-W., Fan, X., Xia, P., Fu, J.-L., Wang, S.-Y., Xu, R.-N., Dai, X.-P., Shi, L., Huang, L., Jiang, T.-J., Shi, M., Zhang, Y., Zumla, A., Maeu75/5000. Immune responses in COVID-19 patients. Nature Immunology 21, 1107–1118 (2020).
- Mick, E., Kamm, J., Pisco, A.O., Ratnasiri, K., Babik, J.M., Calfee, C.S., Castaneda, G., DeRisi, J.L., Detweiler, A.M., Hao, S., Kangelaris, K.N., Kumar, G.R., Li, L.M., Mann, S.A., Neff, N., Prasad, P.A., Serpa, P.H., Shah, S.J., Spottiswoode, N., Tan, M., Christenson, S.A., Kistler, A. & Langelier, C. Upper airway gene expression distinguishes COVID-19 from other acute respiratory illnesses and reveals suppression of innate immune responses by SARS-CoV-2. medRxiv : the preprint server for health sciences (2020). https://doi.org/10.1101/2020.05.18.20105171.
- Wei, J., Alfajaro, M.M., Hanna, R.E., DeWeirdt, P.C., Strine, M.S., Lu-Culligan, W.J., Zhang, S.-M., Graziano, V.R., Schmitz, C.O., Chen, J.S., Mankowski, M.C., Filler, R.B., Gasque, V., de Miguel, F., Chen, H., Oguntuyo, K., Abriola, L., Surovtseva, Y.V., Orchard, R.C., Lee, B., Lindenbach, B., Politi, K., van Dijk, D., Simon, M.D., Yan, Q., Doench, J.G. & Wilen, C.B. Genome-wide CRISPR screen reveals host genes that regulate SARS-CoV-2 infection. (2020). https://doi.org/10.1101/2020.06.16.155101.
- Heaton, B.E., Trimarco, J.D., Hamele, C.E., Harding, A.T., Tata, A., Zhu, X., Tata, P.R., Smith, C.M. & Heaton, N.S. SRSF protein kinases 1 and 2 are essential host factors for human coronaviruses, including SARS-CoV-2. bioRxiv : the preprint server for biology (2020).
Acknowledgments
We thank the patients who participated in this study and their loved ones, the study staff in all the intensive care units who recruited patients at personal risk during the most extreme conditions ever experienced in UK hospitals during one of the most difficult periods of their lives. GenOMICC was funded by the Sepsis Research (Fiona Elizabeth Agnew Trust), the Intensive Care Society, the Wellcome-Beit Prize awarded to J. K. Baillie (Wellcome Trust 103258/Z/13/A), and BBSRC Institute Programme Support Grants (BBS/E/D/20002172, BBS/E/D/10002070, BBS/E/D/30002275). Whole-genome sequencing was performed in partnership with Genomics England, funded by the UK Department of Health and Social Care, UKRI, and LifeArc. ISARIC4C is funded by the following grants: the Medical Research Council [grant MC_PC_19059], the National Institute for Health Research (NIHR) [grant CO-CIN-01], the NIHR Health Protection Research Unit (HPRU) in Emerging and Zoonotic Infections at the University of Liverpool in partnership with Public Health England (PHE), the Liverpool School of Tropical Medicine, and the University of Oxford [grant 200907], the NIHR HPRU in Respiratory Infections at Imperial College London with PHE [award 200927], the Wellcome Trust and Department for International Development [215091/Z/18/Z], the Bill & Melinda Gates Foundation [OPP1209135], and the Liverpool Experimental Cancer Medicine Centre (Grant Reference). Infrastructure support for this research was provided by the NIHR Biomedical Research Centre at Imperial College London [IS-BRC-1215-20013], the EU Platform for Preparedness for (Re)emerging Epidemics (PREPARE) [FP7 project 60252525], and the NIHR Clinical Research Network. PJMO is supported by an NIHR Senior Investigator Award [award 201385]. The views expressed are those of the authors and do not necessarily represent those of the DHSC, DID, NIHR, MRC, Wellcome Trust, or PHE. HM is supported by the NIHR BRC at University College London Hospitals. The Irish Health Research Board (Clinical Trial Network Award 2014-12) funded sample collection in Ireland. This research was conducted using the UK Biobank Resource under project 788. Generation Scotland is funded by the Chief Scientist Office of the Scottish Government Health Directorates [CZD/16/6] and the Scottish Funding Council [HR03006] and is now supported by the Wellcome Trust [216767/Z/19/Z]. Genotyping of GS:SFHS samples was carried out at the Genetics Core of the Edinburgh Clinical Research Facility, University of Edinburgh, and was funded by the UK Medical Research Council and Wellcome Trust (Wellcome Trust Strategic Award Stratifying Resilience and Depression Longitudinally [STRADL] Reference 104036/Z/14/Z). Genomics England and the 100,000 Genomes Project are funded by the National Institute for Health Research, the Wellcome Trust, the Medical Research Council, Cancer Research UK, the Department of Health and Social Care, and NHS England. M. Caulfield is an NIHR Senior Investigator. This research is part of the portfolio of translational research of the NIHR Biomedical Research Centre at Barts and The London. Research at the MRC Human Genetics Unit is funded by the MRC (MC_UU_00007/10, MC_UU_00007/15). LK was supported by an RCUK Innovation Fellowship from the National Productivity Investment Fund (MR/R026408/1). A Bretherick acknowledges funding from a Wellcome Trust Doctoral Training Fellowship for Clinicians (204979/Z/16/Z) and the Edinburgh Clinical Academic Track (ECAT) program. We acknowledge the support from the MRC Human Genetics Unit Programme Grant "Quantitative Traits in Health and Disease" (MC_UU_00007/10). A. Tenesa acknowledges funding from MRC research grant MR/P015514/1, HDR-UK award HDR-9004, and HDR-9003. This study was facilitated by the NIHR Clinical Research Network (NIHR CRN) and the Chief Scientist Office (Scotland), promoting research recruitment in NHS hospitals, and by significant contributions from the global ISARIC and InFACT consortia. The authors thank Dr. Rebecca Coll, Wellcome-Wolfson Institute, Queen's University Belfast, for advice on interpreting these results, and Jie Zheng (University of Bristol) for sharing harmonized GWAS summary statistics used in LD-Hub. The authors acknowledge the substantial improvements to the manuscript and analyses provided by anonymous reviewers. The views expressed here are solely those of the authors and do not represent the official views of the European Commission under any circumstances.
Author Contributions
JK, PK, CHi, PH, AN, DM, LL, DMc, HM, TW, CPP, and JKB contributed to the study design. SC, JF, FG, WO, SK, AF, KRo, LMu, PJO, MGS, AL, and JKB contributed to study coordination. NW, AF, and LMu contributed to laboratory work. EP-C, SC, LK, ADB, KR, DP, SW, NP, MHF, JF, AR, EG, DH, BW, YW, AM, AK, LM, ZY, RZ, CZ, GG, BS, MZ, CH, JY, XS, CPP, AT, KRo, AL, VV, JFW, and JKB contributed to data analysis. SC, CDR, DJP, CHa, CS, MS-H, LT, AH, SCM, AP, ARe, MC, RS, and JKB contributed to case and control recruitment. SC, CDR, RB, JM, and JKB contributed to the interpretation of findings. EP-C, SC, LK, ADB, KR, CDR, RB, JM, CPP, KRo, VV, JFW, and JKB contributed to manuscript preparation. JKB conceived the study and wrote the first draft of the manuscript. All authors approved the final version of the manuscript. The GenOMICC recruitment sites are listed below, in order of the number of patients recruited at each site.
Competing Interests
The authors declare no competing interests.
Additional Information
Supplementary Information is available at https://doi.org/10.1038/s41586-020-03065-y. Correspondence and requests for materials should be addressed to J.K.B.
Peer Review Information: Nature thanks Paul McLaren and the other anonymous reviewers for their contribution to the peer review of this work. Reviewer reports are available.
Reprints and permissions information is available at http://www.nature.com/reprints.
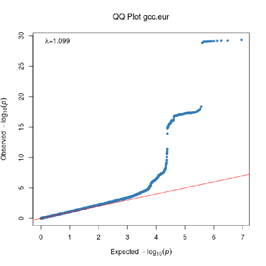
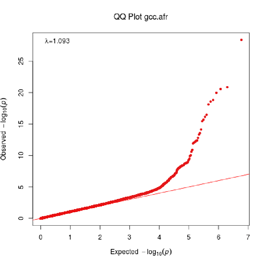
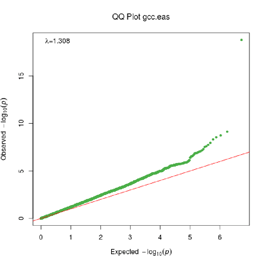
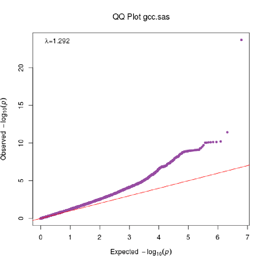
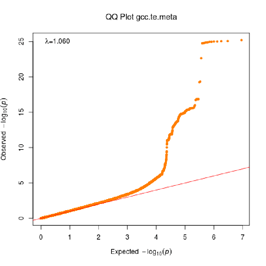
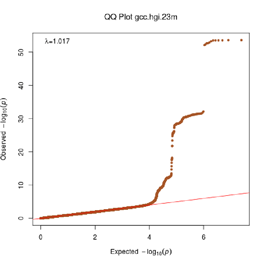
Extended Data Figure 1 Q:Q Plot
The raw (uncorrected) p-values for each ancestral group, including gcc.eur - European, gcc.afr - African, gcc.eas - South Asian, and trans-ethnic meta-analysis (gcc.te.meta), as well as the meta-analysis consisting of GenOMICC, HGI, and 23andMe data (gcc.hgi.23m), are presented. λ - Genomic inflation factor. Note that some residual inflation was observed in the primary analysis in GenOMICC EUR. Repeating the analysis using more principal components (20PC) as covariates did not improve the inflation rate (λ0.5 = 1.10).
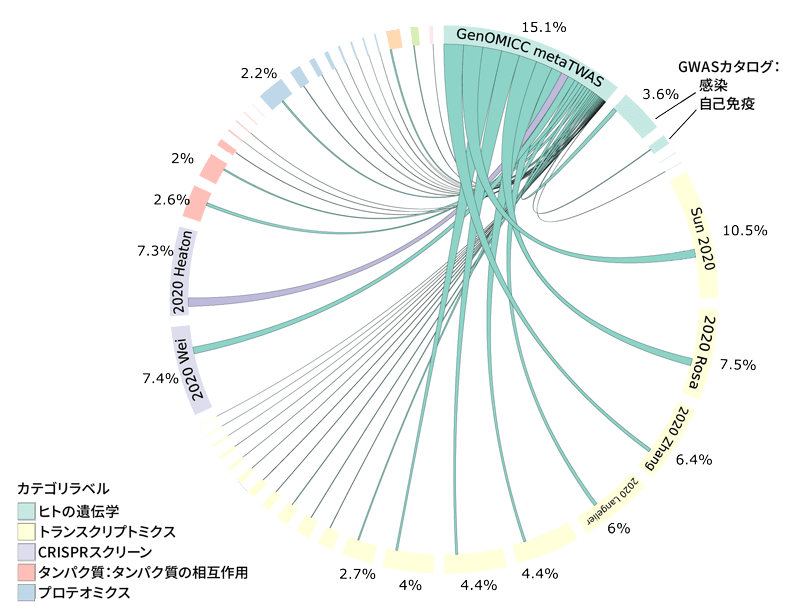
Extended Data Figure 2 MAIC Shared Information Content
Representation of the shared information content among data sources in MAIC analysis. Each experiment or data source is represented by a block on the outer ring of the circle, and the size of the block is proportional to the total information content of the input list. Lines are color-coded according to the dominant data source. Data sources within the same category share the same color (see legend). The largest category and data sources are labeled. An interactive version of this figure is available at https://baillielab.net/maic/covid. To estimate the probability of specific enrichment of the GenOMICC metaTWAS, we randomly sampled from the baseline distribution of metaTWAS genes 1000 times and re-ran MAIC with the same set of Covid-19 systematic review inputs but replaced the input list with the random samples in place of the GenOMICC metaTWAS results. Based on these empirical results, we modeled a normal distribution and estimated the probability of MAIC being this strongly enriched by random chance as p = 4.2×10^-12.
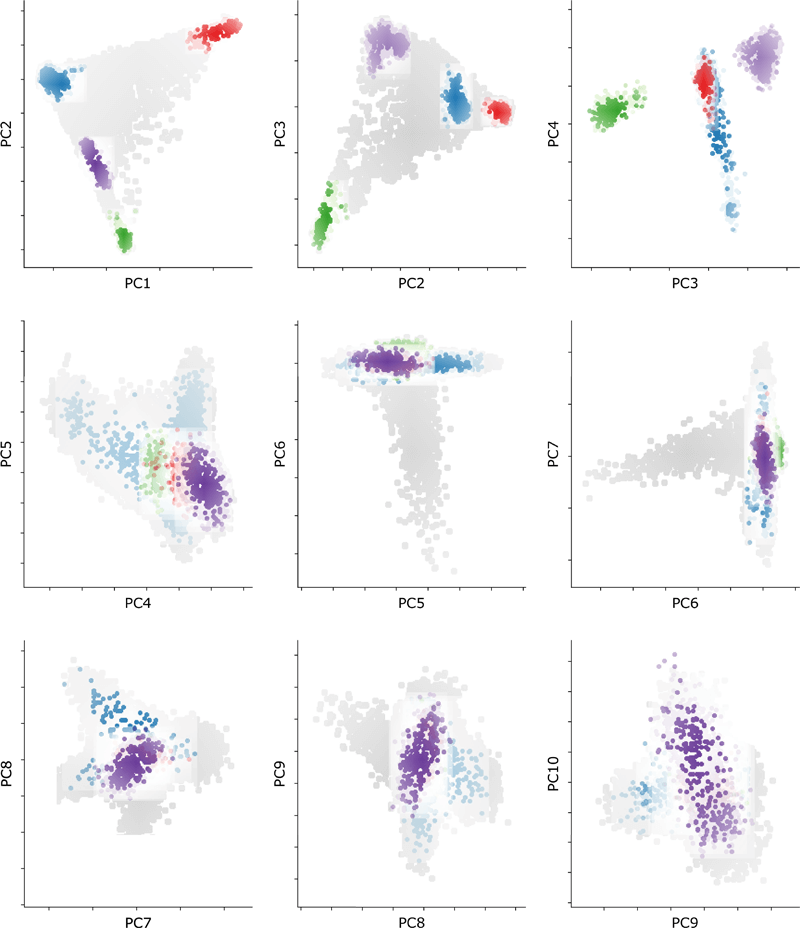
Extended Data Figure 3 Genomic Overlap between Cases and Controls
PCA plot showing the distribution of all cases and controls for the first 10 principal components. Cases are represented by colored closed circles: Europe (EUR, blue), Africa (AFR, red), East Asia (EAS, green), and South Asia (SAS, purple). Controls for each ancestral group are represented by closed circles in lighter shades of their respective colors. The population background from the UK Biobank is shown as closed circles in light gray.
rs2236757 A/G
| Cohort | Odds Ratio | OR | 95%-CI | Weight | |
|---|---|---|---|---|---|
| gee-AFR | 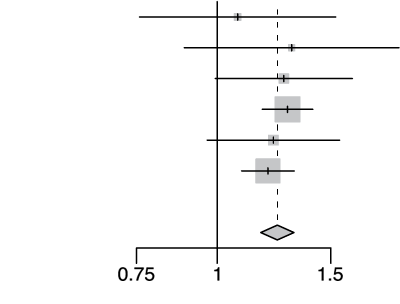 |
1.08 | [0.76; 1.53] | 2.9% | |
| gee-EAS | 1.30 | [0.89; 1.91] | 2.4% | ||
| gee-SAS | 1.27 | [0.99; 1.62] | 5.9% | ||
| gee-EUR | 1.29 | [1.17; 1.41] | 43.0% | ||
| 23m | 1.22 | [0.96; 1.55] | 6.3% | ||
| hgi | 1.20 | [1.09; 1.32] | 39.7% | ||
| Fixed Effect Model | 1.24 | [1.17; 1.32] | 100.0% | ||
| Heterogeneity: I2=0%, τ2=0, d= 0.87 | p-val=1.16e-12 | ||||
rs73064425 T/C
| Cohort | Odds Ratio | OR | 95%-CI | Weight | |
|---|---|---|---|---|---|
| gee-AFR | 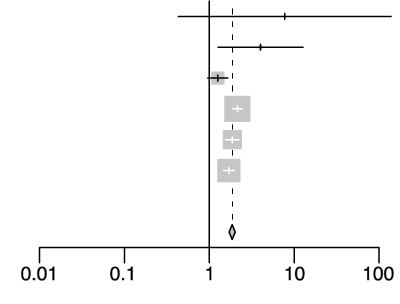 |
7.74 | [0.43; 138.83] | 0.1% | |
| gee-EAS | 4.02 | [1.26; 12.76] | 0.5% | ||
| gee-SAS | 1.26 | [0.96; 1.66] | 9.0% | ||
| gee-EUR | 2.14 | [1.88; 2.45] | 39.3% | ||
| 23m | 1.87 | [1.56; 2.24] | 20.2% | ||
| hgi | 1.70 | [1.47; 1.98] | 31.0% | ||
| Fixed Effect Model | 1.86 | [1.71; 2.02] | 100.0% | ||
| Heterogeneity: I2=69%, τ2=0.0281, p<0.01 | p-val=1.97e-49 | ||||
rs2109069 A/G
| Cohort | Odds Ratio | OR | 95%-CI | Weight | |
|---|---|---|---|---|---|
| gee-AFR |  |
0.84 | [0.59; 1.21] | 2.3% | |
| gee-EAS | 0.93 | [0.55; 1.58] | 1.1% | ||
| gee-SAS | 1.11 | [0.83; 1.47] | 3.7% | ||
| gee-EUR | 1.36 | [1.25; 1.48] | 41.1% | ||
| 23m | 1.13 | [0.99; 1.29] | 17.2% | ||
| hgi | 1.19 | [1.08; 1.31] | 34.5% | ||
| Fixed Effect Model | 1.23 | [1.16; 1.30] | 100.0% | ||
| Heterogeneity: I2=61%, τ2=0.0091, p=0.03 | p-val=3.10e-13 | ||||
rs10735079 G/A
| Cohort | Odds Ratio | OR | 95%-CI | Weight | |
|---|---|---|---|---|---|
| gee-AFR |  |
0.90 | [0.62; 1.32] | 2.2% | |
| gee-EAS | 0.69 | [0.41; 1.18] | 1.1% | ||
| gee-SAS | 1.24 | [0.96; 1.60] | 4.8% | ||
| gee-EUR | 0.77 | [0.71; 0.85] | 38.7% | ||
| 23m | 0.96 | [0.83; 1.12] | 13.8% | ||
| hgi | 0.87 | [0.80; 0.95] | 39.4% | ||
| Fixed Effect Model | 0.86 | [0.81; 0.91] | 100.0% | ||
| Heterogeneity: I2=69%, τ2=0.0135, p<0.01 | p-val=5.04e-08 | ||||
rs12004298 (ABO locus)
| Cohort | Odds Ratio | OR | 95%-CI | Weight | |
|---|---|---|---|---|---|
| gee-EUR |  |
1.11 | [1.01; 1.21] | 33.7% | |
| hgi | 1.20 | [1.10; 1.31] | 31.1% | ||
| 23m | 1.15 | [1.06; 1.25] | 35.2% | ||
| Fixed Effect Model | 1.15 | [1.09; 1.21] | 100.0% | ||
| Heterogeneity: I2=0%, τ2=0, p=0.44 | |||||
Extended Data Figure 4 Effect Sizes in Ancestral Groups within the GenoMICC Study
The data show four replicated variants with genome-wide significant associations at the GenOMICC (a-d) and ABO locus (e). The forest plots display the heterogeneity measures and p-values (p) of effect sizes under the fixed effect model, meta-analysis estimates with 95% confidence intervals, and p-values (P-val). The bold alleles indicate the reference alleles for the reported effect (odds ratio). The sample sizes of cases + controls analyzed in the four groups are as follows: African (AFR) 1092 in GenOMICC, East Asian 894, European 10055, and South Asian (SAS) 1422. HGI - Covid-19 Host Genetics Initiative; 23m - 23andMe. The observed heterogeneity in effect sizes may be due to true differences between ancestral groups, limited statistical power in small groups (evidenced by wide confidence intervals), or residual confounding factors.
Extended Data Table 1 Baseline Characteristics of 2244 Patients
| Characteristic | GenOMICC (n=2109) | ISARIC 4C (n=135) | ||
|---|---|---|---|---|
| Missing Data | Missing Data | |||
| Female sex | 624 (30%) | 46 (34%) | ||
| Age (years, mean ± SD) | 57.3 ± 12.1 | 57.3 ± 2.9 | ||
| European ancestry | 1573 (75%) | 103 (76%) | ||
| South Asian ancestry | 219 (10%) | 18 (13%) | ||
| African ancestry | 174 (8%) | 8 (6%) | ||
| East Asian ancestry | 143 (7%) | 6 (4%) | ||
| Major comorbidities | 396 (19%) | 49 (2%) | 40 (30%) | 26 (19%) |
| Invasive ventilation | 1557 (74%) | 35 (2%) | 25 (19%) | 31 (25%) |
| Death (60 days) | 459 (22%) | 338 (16%) | 22 (16%) | 30 (22%) |
Principal component analysis (Extended Data Fig. 3) was used to determine ancestral groups. Significant comorbidities in GenOMICC were defined as the presence of functionally limiting comorbidities as assessed by the treating clinician. In ISARIC4C, significant comorbidities refer to the presence of chronic heart disease, lung disease, kidney disease, liver disease, cancer, or dementia. Age is presented as mean ± standard deviation.
Extended Data Table 2 Replication in External Data
| SNP | chr:pos(b37) | Risk | Alt | ORgcc.ukb | Pgcc.ukb | 0Rhgi.23m | Phgi.23m | Locus |
|---|---|---|---|---|---|---|---|---|
| rs73064425 | 3:45901089 | T | C | 2.1 | 4.8x10⁻³⁰ | 1.7 | 1.5x10⁻²⁸* | LZTFL1 |
| rs9380142 | 6:29798794 | A | G | 1.3 | 3.2x10⁻⁸ | 1 | 0.76 | HLA-G |
| rs143334143 | 6:31121426 | A | G | 1.9 | 8.8x10⁻¹⁸ | 1.1 | 0.019 | CCHCR1 |
| rs3131294 | 6:32180146 | G | A | 1.5 | 2.8x10⁻⁸ | 0.99 | 0.91 | NOTCH4 |
| rs10735079 | 12:113380008 | A | G | 1.3 | 1.6x10⁻⁸ | 1.1 | 0.00082* | OAS1/3 |
| rs2109069 | 19:4719443 | A | G | 1.4 | 4x10-12 | 1.1 | 5x10⁻⁵* | DPP9 |
| rs74956615 | 19:10427721 | A | T | 1.6 | 2.3x10⁻⁸ | 1.4 | 2x10⁻⁶* | TYK2 |
| rs2236757 | 21:34624917 | A | G | 1.3 | 5x10⁻⁸ | 1.2 | 4.1x10⁻⁵* | IFNAR2 |
Risk – Risk allele; Alt – Alternate allele; OR – Effect size of the risk allele (odds ratio). CI – 95% confidence interval for the odds ratio. P – p-value, Locus – Gene closest to the top SNP. Subscript identifiers indicate the data source. gcc – GenOMICC study, European ancestry, comparison with the UK Biobank. hgi.23m – Covid-19 Host Genetics Initiative and 23andMe meta-analysis used for replication. * Bonferroni significant values are highlighted, indicating external replication.